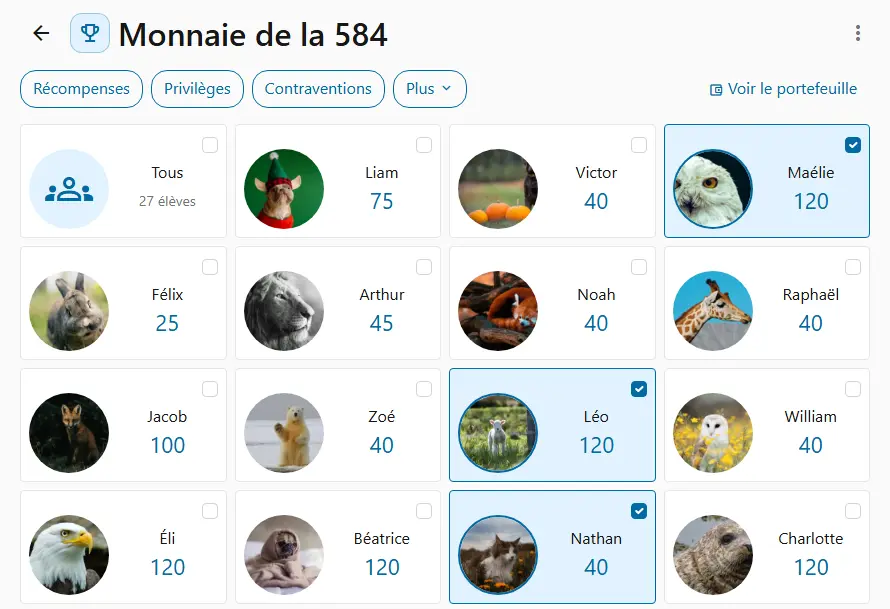
A unit's results
You mark each student's quiz, oral presentation and logbook.
The unit's total adds up as you go, with no spreadsheet.
Enter a mark, pick a level, write what you observe: a grid that fits your class, one row per student, and totals computed for you.
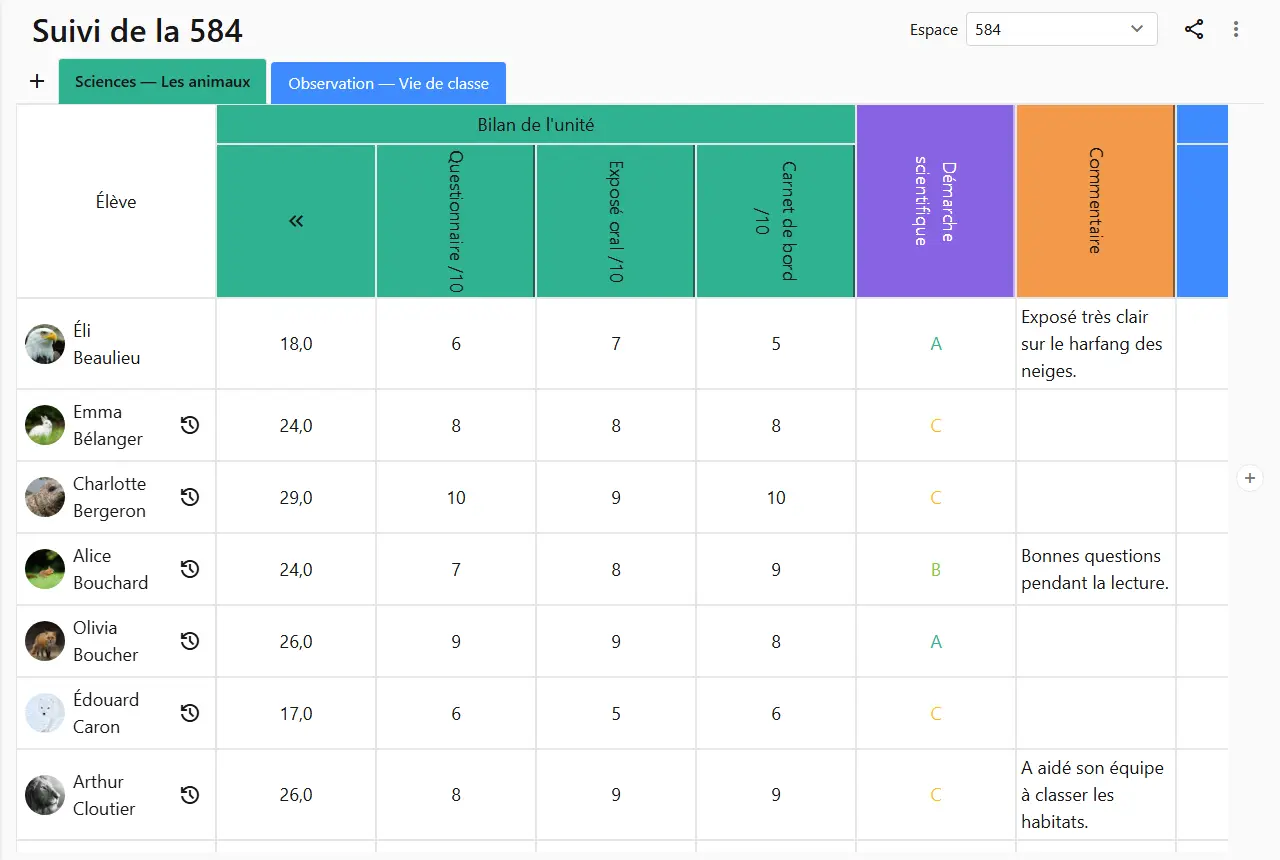
Organize your assessments in tabs, one subject or unit each, and give each criterion its column. Group criteria under one column: their total computes itself.
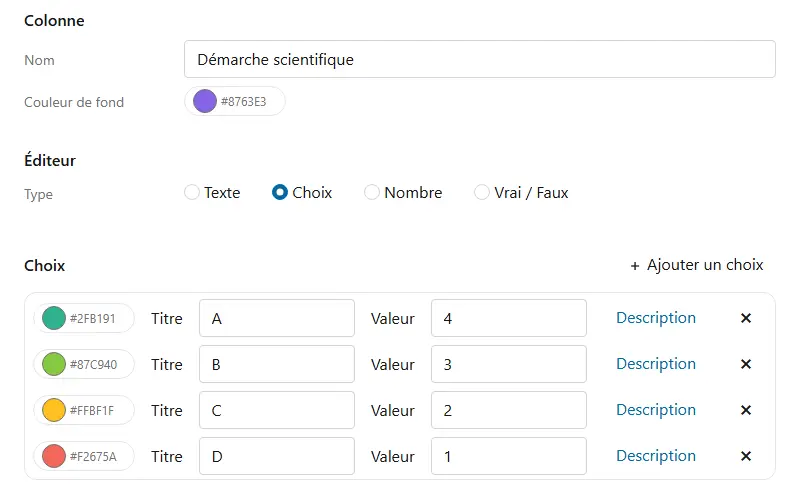
An observation tab next to your assessments: autonomy, collaboration, and what you notice in class, for each student.
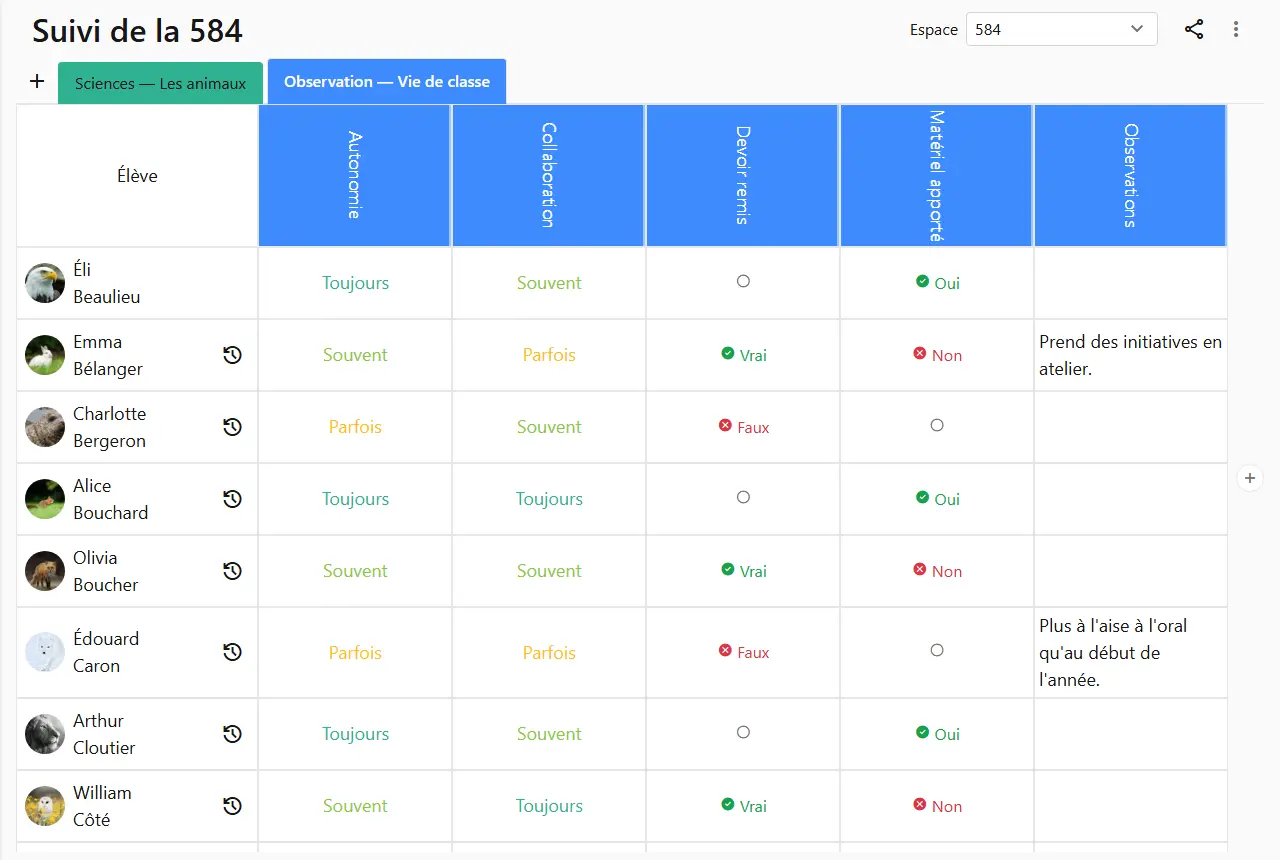
Choose the class: its students become the rows of the grid, with their photo.
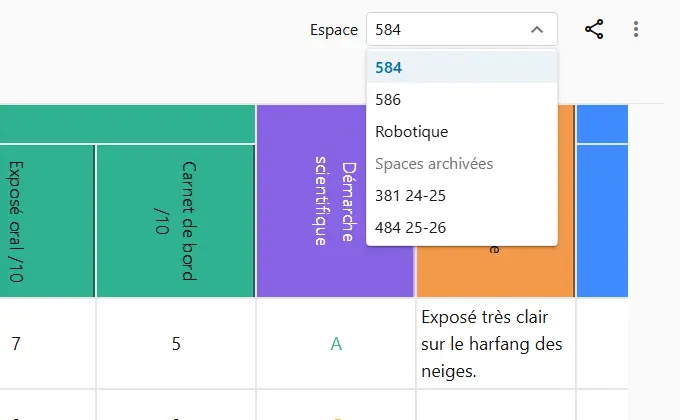
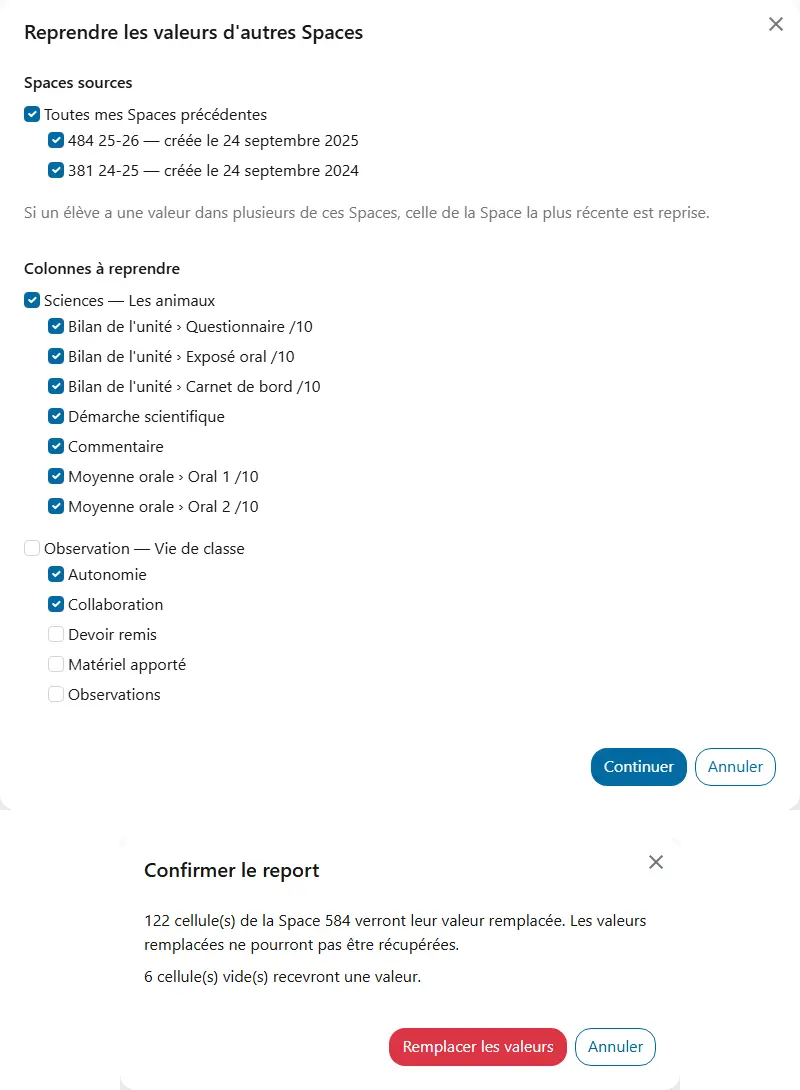
At back-to-school, don't start from scratch.
How teachers use it on an ordinary school day.
You mark each student's quiz, oral presentation and logbook.
The unit's total adds up as you go, with no spreadsheet.
During workshops, you note each student's autonomy and collaboration, and a word on what you notice.
When report cards come, you have a portrait of every student.
With your colleagues, you share a grid; each applies it to their classes.
The same criteria for all, and everyone keeps their own values.
Before meeting a student, you reread their observations and their term's marks.
The student knows where they stand, with examples.